Other Features
RTEMS Thread Support
DMON will poll on request the thread table of RTEMS, parsing the structures described below. This functionality requires that some ELF symbols are defined for the program loaded:
• RTEMS Version is read from _RTEMS_version
• Threads tables are searched for in the following locations:
- o _RTEMS_tasks_Information
- o _Thread_Internal_information
• The currently Executing thread control block is read from *_Thread_Executing
• The start and end of ram determined during memory probing are used to sanity check the values read from the tables in order to avoid attempting to read invalid memory addresses.
NOTE: loading an RTEMS application may not initialise the memory for the thread tables. In that case running the RTEMS command from the console or GUI before starting the program will give incorrect results.
This functionality is only supported for RTEMS versions which are identified in the version string as compiled for SPARC. The version string found is shown on starting monitoring (GUI) or when the command is run. If the version is not one of the supported versions polling will be attempted anyway with the defined structures; the user is warned.
There are two commands available from the console:
rtems Read current RTEMS thread information (if available)
rtems dump Dump structures used to read RTEMS thread information
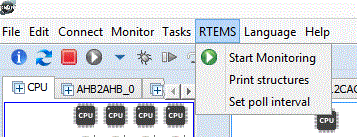
Once an RTEMS application has been loaded at least once during the session, and the GUI is active, a GUI menu is available:
If “Start Monitoring” is selected, the Thread tables will be polled at the specified interval – by default once per second. The results are shown in a GUI window. This window cannot be closed while polling is active, regardless of whether the application is running or not. Polling can be stopped from the menu. Once started, the “Start Monitoring” menu point becomes a “Stop Monitoring” menu point.
The following are read from each thread structure:
| Name | C variable | Type | Offset : Size |
|---|---|---|---|
| API | the_api | Objects_APIs | 0 : 4 |
| Max. Index | maximum | unsigned short int | 16 : 2 |
| Table | local_table | Objects_Control ** | 28 : 4 |
Each Thread control block has the following data read from it:
| Name | C variable | Type | Offset : Size |
|---|---|---|---|
| Name | Object.name | Objects_Name | 12 : 4 |
| ID | Object.id | Objects_Id | 8 : 4 |
| Priority | current_priority | Priority_Control | 20 : 4 |
| Entry Point | Start.entry_point | Thread_Entry | 156 : 4 |
| Current PC | Registers.o7 | uint32_t | 340 : 4 |
| Running time | cpu_time_used | struct timespec | 132 : 8 |
| State | current_state | long unsigned int | 16 : 4 |
Example output for console command:
rtems-4.10.1(SPARC/w/FPU/leon3)
TA1 CLASSIC 0x0a010002 1 0x40001420 (Test_task) 0x40016bfc (_Thread_Dispatch + 0xd8) 0:00:00,960459000 0x00000008 (Delaying)
* TA2 CLASSIC 0x0a010003 1 0x40001420 (Test_task) 0x4000a194 (apbuart_outbyte_polled + 0xc) 0:00:00,374664000 0x00000000 (Ready)
TA3 CLASSIC 0x0a010004 1 0x40001420 (Test_task) 0x40016bfc (_Thread_Dispatch + 0xd8) 0:00:00,254531000 0x00000008 (Delaying)
IDLE INTERNAL 0x09010001 255 0x40009e10 (bsp_idle_thread) 0x40016bfc (_Thread_Dispatch + 0xd8) 0:04:38,710598000 0x00000000 (Ready)
GDB Remote Target
GDB is a standard command line debugger. It needs to be ported to a particular gcc tool chain and also needs to be aware of the operating system (if any). Programmes compiled as a Bare-C or using RTEMS use sparc-rtems-gdb. Programmes compiled using sparc-elf-gcc will use sparc-elf-gdb.
For complete details on GDB functionality, refer to the GDB Manual, available online at the following URL https://sourceware.org/gdb/current/onlinedocs/gdb/ (Note that this is for the latest version, and the versions used are typically older
GDB provides a remote protocol for communication between GDB and a target. The GDB server component of DMON supports this protocol.
DMON must be listening for GDB connections. This is done by issuing the “gdb” command at the DMON console. This takes a TCP port as an optional argument. The default port is 1234.
GDB needs to connect to DMON. This is done by issuing the following command at the gdb prompt.
- target extended-remote <ip address/hostname of machine running DMON>:<port>
If both DMON and GDB are run on the same machine “localhost” or simply “:port” can be used.
GDB operation is then as normal. It is possible to issue any DMON command through GDB and the output of these commands is visible on the GDB console. These commands need to be prefixed with the keyword “monitor”. Note that using commands which start or stop the program will interfere with GDB knowledge of the program and will lead to errors. Break and watchpoints should only be set using GDB and run and continue should only be issued through GDB.
After loading the program, it should be started with the “run” command to ensure correct initialisation, “continue” should only be used after a breakpoint has been hit.
Note that is typically necessary to reload an RTEMS application that has been run already before running it again – this is because loading the program correctly initialises data tables used by RTEMS.
Note that GDB will timeout after about 2 seconds if it does not receive any input from DMON. To avoid this happening an empty string is sent to GDB every 1.5 seconds when a long running command is running. This prevents the timeout but does not affect what a human user sees. It may affect what is seen in a GDB scripted session.
The user can modify the GDB Timeout by issuing the following GDB cli option or command before connecting to DMON:
- -l timeout Sets the timeout (in seconds) of any communication used by GDB for remote debugging.
At the GDB prompt it is possible to issue the command “set remotetimeout num” which sets the timeout limit to wait for the remote target to respond to num seconds. The default is 2 seconds. If connections are causing problems it is recommended to increase this timeout.
DMON supports setting Software Breakpoints, Hardware Breakpoints and Read/Write and Access Watchpoints through GDB. There are several limitations on this; see below.
The DMON GDB Server only allows one GDB connection at a time. It will continue listening for GDB connections and serving them until either the “gdb detach” command is executed or CTRL-C is pressed for DMON. CTRL-C works as though the GDB detach command had been issued first.
There are limitations around the use of data watchpoints and hardware breakpoints:
- 1. HW Breakpoints and watchpoints are set on all CPUs in a multiple cpu system if requested by GDB.
- 2. If GDB requests more than the number of watchpoints/hardware breakpoints that are supported by the board, DMON will return an error code. The behaviour seen by the GDB user is that GDB reports a message such as “Cannot remove breakpoints because program is no longer writable.”
If a problem is observed in conjunction with the GDB tool additional helpful information can be gained from the communications log in GDB. To get such a log, issue the command “set remotelogfile <filename>” before connecting to DMON with “target extended-remote”
Trace Buffer and Call Graph Support
DMON allows a complete instruction trace to be obtained from a running application. Profile information is presented graphically and a file with each executed instruction is produced for offline analysis. This is in addition to the profile command, which samples the program counter periodically and therefore is only an estimate.
The itrace enable command initiates the instruction trace capture. This command will only work on processors with an instruction trace capability, and the command will not be available unless the hardware support is. It will significantly slow down operation as the instruction trace buffer can only be read when the processor is stopped – therefore the processor is stopped each time the buffer is full. Note also that this feature uses the hardware breakpoint functionality, and may conflict with hardware breakpoints set by the user. It is recommended not to use HW breakpoints when using itrace.
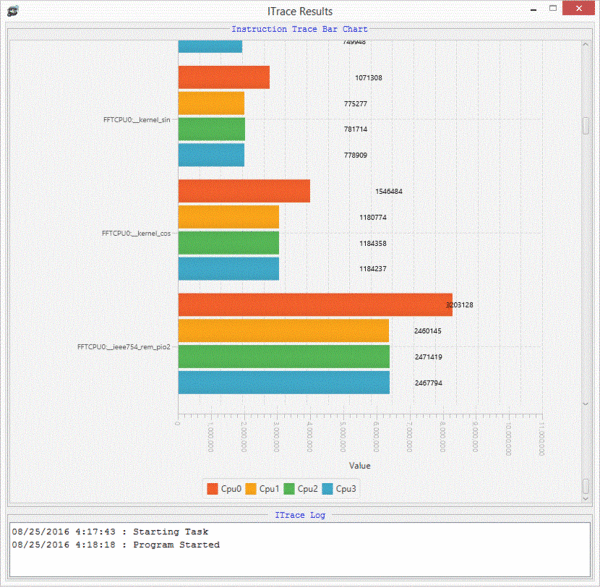
Part of a sample profile is shown below. The vertical axis shows the function names executed, taken from the ELF symbols. The horizontal axis shows the number of times the function has been called. Different colours on the bars indicate which CPUs executed the function.
Note that the graph functionality requires ELF symbols. If there are none available then the instructions will be logged but the graph will be empty.
The detailed instruction trace data is written into the folder C:\Users\<username>\DMON\UserData on Windows or /home/<username>/DMON/UserData on Linux with the name iTraceLogDD-MM-YYYY_HHMMSS.txt. A new log file is started once 50 MB of data has been accumulated; the files from the same program run are labelled with the same time stamp but part_0, part_1 etc. in sequence. The file initially created will be renamed to part_0. An example of the start of a trace file is shown below. These files contains every instruction executed during the run and may be used for offline analysis.
## LOGGING STARTED 10-05-2016_143029

00470298310 cpu0  40002AD8  sethi %hi(0xa5a5a400), %g2    [A5A5A400]

00470298310 cpu3  40002278  cmp %g2, 0xc                  [FFFFFFF9]

00470298311 cpu0  40002ADC  bset 0x1a5, %g2               [A5A5A5A5]

00470298311 cpu3  4000227C  ld [%fp + 0x68], %g2          [13483119]

00470298319 cpu0  40002ADC  bset 0x1a5, %g2               [A5A5A5A5]

00470298320 cpu0  40002AE0  st %g2, [%l0 + 0x3c]          [410800BC]

00470298321 cpu0  40002AE4  mov 0x1, %g2                  [00000001]

00470298327 cpu0  40002AE8  st %g2, [%l0 + %g0]           [41080080]

00470298328 cpu0  40002AEC  cmp %g1, 0x0                  [00000002]

00470298329 cpu0  40002AF0  be giveToCpu + 0x104          [00000000]

00470298330 cpu0  40002AF4  sethi %hi(0x380b0000), %g1    [380B0000]

00470298333 cpu0  40002AF8  bset %g1, %i0                 [380B0004]

00470298334 cpu0  40002AFC  sethi %hi(0x80000000), %g1    [80000000]

00470298335 cpu0  40002B00  bset 0x210, %g1               [80000210]

00470298339 cpu3  4000227C  ld [%fp + 0x68], %g2          [00000000]

00470298341 cpu0  40002B04  st %i0, [%g1 + %g0]           [80000210]

00470298341 cpu3  40002280  st %g2, [%fp - 0x8]           [67FFFE98]

00470298342 cpu0  40002B08  ret                           [40002B08]

00470298343 cpu0  40002B0C  restore                       [00000000]

00470298343 cpu3  40002284  ld [%fp + 0x70], %g2          [00000000]

00470298349 cpu3  40002288  st %g2, [%fp - 0x4]           [67FFFE9C]

00470298350 cpu3  4000228C  mov %i1, %g1                  [0000000A]
The video below gives a brief demo of the callgraph command.
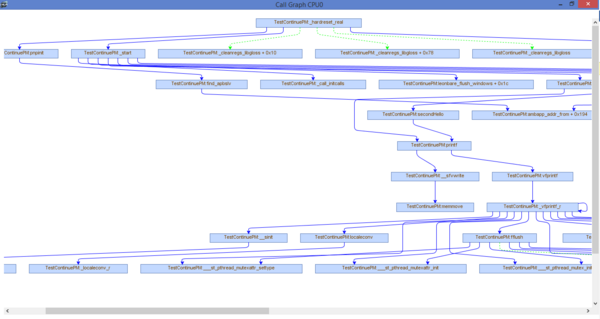
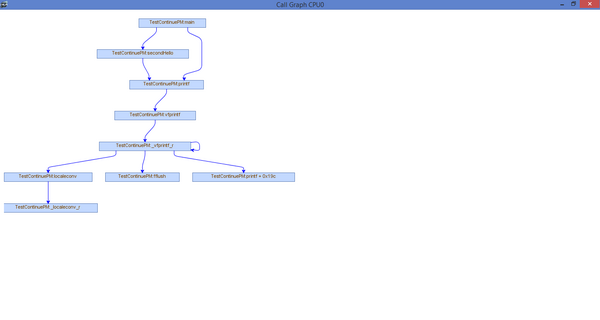
If trace buffer is enabled and a program has been executed, you can issue the callgraph command. The callgraph command allows you to see graph of each function found during itrace and its call hierarchy. The callgraph command can accept as its first argument the root node which sets the graph root to that function and anything not called from here is discarded. Here is example of issuing the “callgraph” command on its own
callgraph
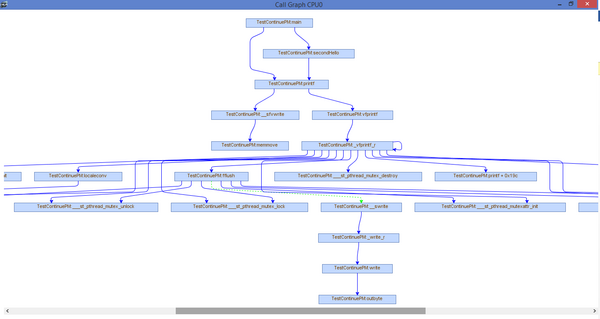
If we issue “callgraph main”, you will see that the root node is the main function and anything before this function call or not called from main isn’t visible
callgraph main
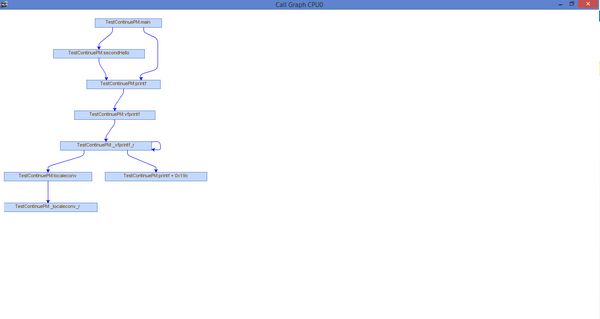
Another feature of the callgraph command is filtering. The filtering argument (which is used with “filter:”) can accept multiple regular expressions so that any functions matching those filters are excluded from the graph. This image shows the exclusion of any function that begins with “__” with the root still being main
callgraph main filter: __
As mentioned before we can include many different expressions to filtering, here is an example of having the root as main and filtering with “__” and “fflush”
callgraph main filter: __ fflush
There are also a few built in expressions that can be used for convince
callgraph filter: rtems            rtems functions prefixed with rtems_ are removed
callgraph filter: ecos             ecos functions called prefixed with cyg_ are removed
callgraph filter: _                functions prefixed with _ are removed
callgraph filter stdlib            standard stdlib function calls removed
LEON4/LEON3 Statistics Module
If the Leon 4/3 statistics module is present on the target it can be configured either graphically or using commands. It is outside the scope of this document to give a full description of the LEON4 Statistics module; the user should consult the document supplied with their particular hardware.
It should however be noted that a single device will be present on two buses, and the user should choose the interface through which the device is controlled to minimize impact on their testing. If more than one device is present on the target, the command for second device has underscore and index (l3stat_1).
DMON > l3stat events
datawritebuffhold    : Data write buffer hold                             : 0x10
totalinscount        : Total instruction count                            : 0x11
intins               : Integer instructions                               : 0x12
fpunitinscount       : Floating-point unit instruction count              : 0x13
branchpremiss        : Branch prediction miss                             : 0x14
exectime             : Execution time, excluding debug mode               : 0x15
ahbutilper           : AHB utilization (per AHB master)                   : 0x17
hbutiltotal         : AHB utilization(total)                             : 0x18
.........
DMON > l3stat status
CPU0   Total instruction count   0
CPU0   Branch prediction miss   0
CPU0   Execution time, excluding debug mode   0
CPU0   Branch prediction miss   0
DMON > l3stat display workers all

Worker 0:
 CurrentRead                          :0
 Hold                                 :false
 Time                                 :0.0
 Interval                             :1000
 TotalRead                            :0
 Counter                              :0
 Running                              :false
 RunPoll                              :true
 EventID                              :Data write buffer hold
 CleanOnRead                          :true
 Enabled                              :true
Worker 0:
 CurrentRead                          :0
 Hold                                 :false
 Time                                 :0.0
 Interval                             :1000
 TotalRead                            :0
 Counter                              :1
 Running                              :false
 RunPoll                              :true
 EventID                              :Integer instructions
 CleanOnRead                          :true
 Enabled                              :true
DMON > l3stat display workers 3

Worker 3:
 CurrentRead                          :0
 Hold                                 :false
 Time                                 :99.74
 Interval                             :1000
 TotalRead                            :0
 Counter                              :3
 Running                              :true
 RunPoll                              :false
 EventID                              :Branch prediction miss
 CleanOnRead                          :true
 Enabled                              :true
DMON > l3stat display counters all

Counter 0 :
 EventID                              :Data write buffer hold
 CleanOnRead                          :true
 Enabled                              :true
 Counter                              :0
 CPU                                  :0
 CounterValue                         :0
 EventLevel                           :false

Counter 1 :
 EventID                              :Integer instructions
 CleanOnRead                          :true
 Enabled                              :true
 Counter                              :1
 CPU                                  :0
 CounterValue                         :0
 EventLevel                           :false
DMON > l3stat set 0 cpu=0 event=0x15 cl=1 su=0 en=1  // Set in counter 0 CPU/AHB index to 0, event to 0x15( or abbreviation can be used "exectime") event=0x15 ,clear on read en=1,  Supervisor/User mode filter su=0 and Enable counter (EN) en=1

Warning. Parameter event cannot be evaluated. Using as it is : 0x15
Command l3stat set executed successfully.
DMON > l3stat duration 3 enable lvl // Enable duration on counter 3 and set Level
DMON > l3stat poll 2 1000 save // Start polling counter 2 at 1000ms interval and save data to the csv file
DMON > l3stat poll 2 1000 hold save // Start polling enable bit in control register of counter 2 at 1000ms interval till software or user enables counter and only then DMON will start to poll value register and save data to the csv file
DMON > l3stat runpoll 1 1000 save // DMON will start polling counter 1 when program starts running on the board at interval 1000ms and save data to csv file
DMON > l3stat stop 3   // Stop polling counter 3. The counter will be disabled. If started with save option, then data will be available in csv file located in DMON installation directory and file name l3stat_Counter_3-07-17-2019 16-40-38.csv

The polling worker for counter 3 was stopped

Disabled counter: 3 Device: 0
DMON > l3stat stop all  // Disable all the polling workers

The polling worker for counter 0 was stopped
The polling worker for counter 1 was stopped
The polling worker for counter 2 was stopped
The polling worker for counter 3 was stopped

Disabled counter: 3 Device: 0
Disabled counter: 2 Device: 0
Disabled counter: 1 Device: 0
Disabled counter: 0 Device: 0
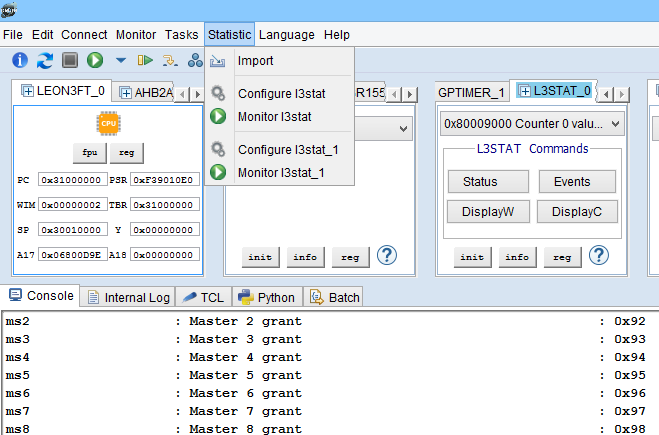
DMON Statistic Module Menu :
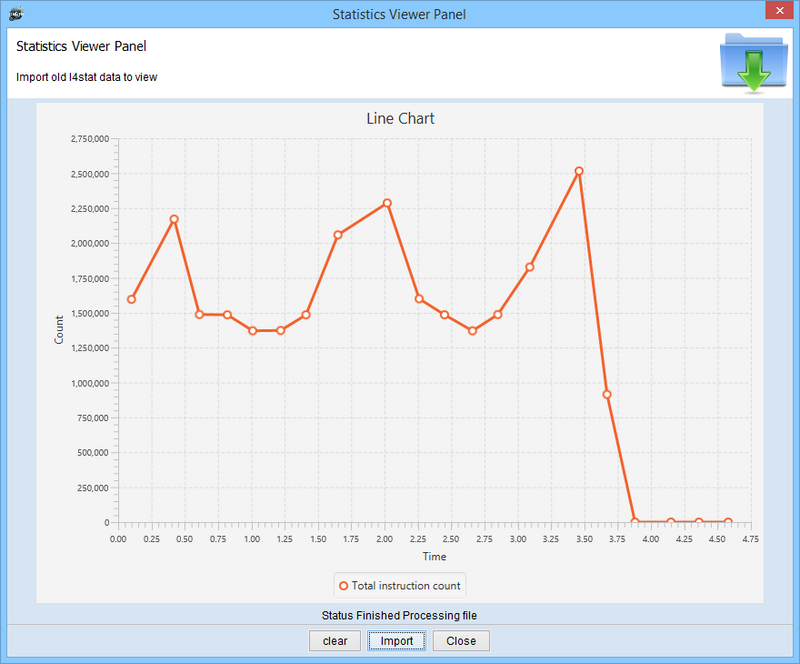
Statistic Viewer Panel. User can load previously generated csv file by statistic module
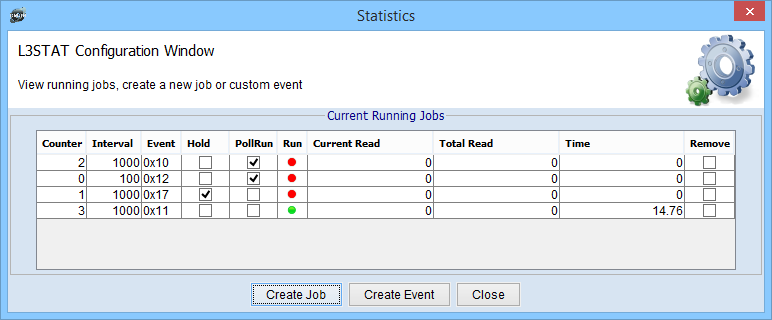
Statistic Jobs Status View per device. All Created jobs are displayed in this view. User can cancel job by clicking in "Remove" column.
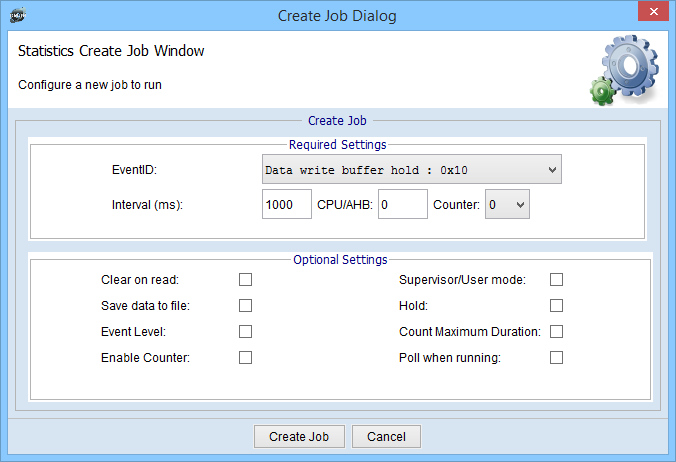
Create New Job Dialog. Hover all the fields to get more information. Optional settings will set Counter Control Register. This register can be configured before and left empty except job configurations like save to file, hold or Poll when running, functionality of which are described above.
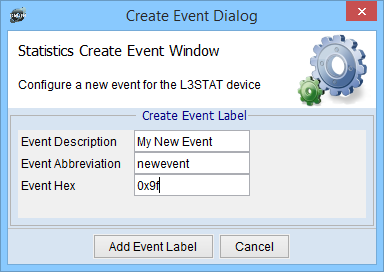
Create New Event Dialog. If DMON is missing event that supported by Hardware, than user can add this event and use in commands
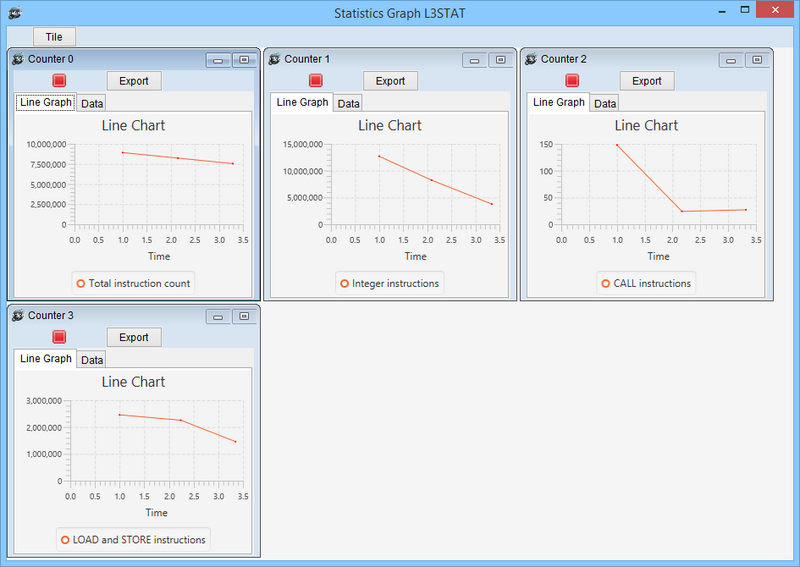
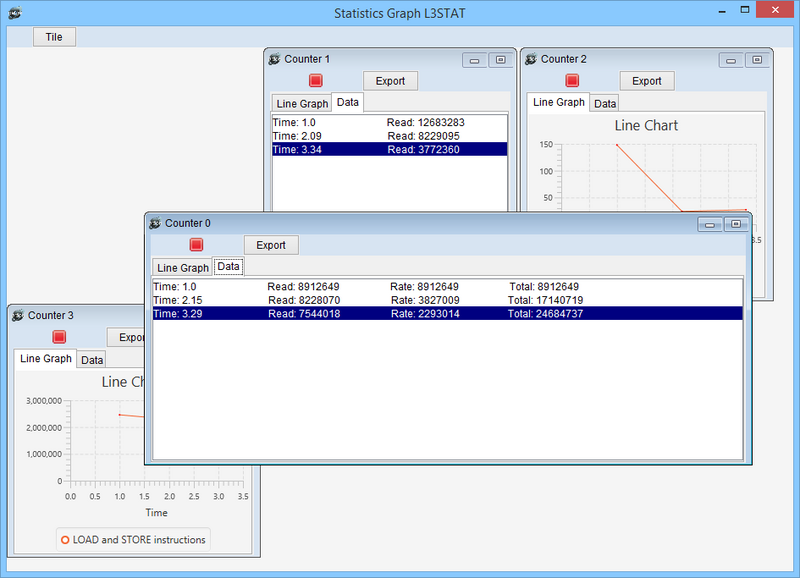
Statistics Graph. Shows data as Line Graph per counter.
Statistics Graph. Shows data as table per counter.
Video Tutorial:
| Command | Command Description |
|---|---|
| l4stat events | Show all events that can be selected/counted |
| l4stat events [hex][abbr][descr] | Add new event to DMON (hardware must support this code). hex->code value, abbr->abbreviation, descr->description |
| l4stat clear [cnt] | Clear the counter cnt. |
| l4stat status | Display status of all available counters. |
| l4stat display [workers|counters] <all|n> | Display information on workers or counters |
| l4stat set [cnt][flag=value] | Count the event using counter cnt on processor cpu. Use enable flag(en) the last. Available flags: cpu=val, event=val, cl=1|0, su=0|1|2, en=1|0 |
| l4stat duration [cnt][enable|disable]<lvl> | If Enabled the core will save the maximum time the selected event has been at the level specified by the EL field. If level(lvl) is present the counter will count the cycles, otherwise will count the time between event assertions |
| l4stat poll [cnt][int]<hold><save> | Continuously poll counter(cnt) at interval(int)(min value 100 ms).If hold parameter is passed, DMON will poll for Counter control register till software enables the counter and only then will start to poll for counter value. If save parameter is used, DMON will save data to csv file |
| l4stat runpoll [cnt][int]<save> | Poll counter(cnt) at interval(int)(min value 100 ms) while application is running. DMON will start polling, when program starts running on the board. If breakpoint is hit, DMON will pause polling and resume after program will continue. If save parameter is used, DMON will save data to csv file |
| l4stat stop [cnt|all] | Stop polling of Counter Register for counter(cnt) or all and disable counter |
| l3stat events | Show all events that can be selected/counted |
| l3stat events [hex][abbr][descr] | Add new event to DMON (hardware must support this code). hex->code value, abbr->abbreviation, descr->description |
| l3stat clear [cnt] | Clear the counter cnt. |
| l3stat status | Display status of all available counters. |
| l3stat display [workers|counters] <all|n> | Display information on workers or counters |
| l3stat set [cnt][flag=value] | Count the event using counter cnt on processor cpu. Use enable flag(en) the last. Available flags: cpu=val, event=val, cl=1|0, su=0|1|2, en=1|0 |
| l3stat duration [cnt][enable|disable]<lvl> | If Enabled the core will save the maximum time the selected event has been at the level specified by the EL field. If level(lvl) is present the counter will count the cycles, otherwise will count the time between event assertions |
| l3stat poll [cnt][int]<hold><save> | Continuously poll counter(cnt) at interval(int)(min value 100 ms).If hold parameter is passed, DMON will poll for Counter control register till software enables the counter and only then will start to poll for counter value. If save parameter is used, DMON will save data to csv file |
| l3stat runpoll [cnt][int]<save> | Poll counter(cnt) at interval(int)(min value 100 ms) while application is running. DMON will start polling, when program starts running on the board. If breakpoint is hit, DMON will pause polling and resume after program will continue. If save parameter is used, DMON will save data to csv file |
| l3stat stop [cnt|all] | Stop polling of Counter Register for counter(cnt) or all and disable counter |
Remote Access using DMON
The target system may need to be shared by different developers, some of whom are working remotely, or be in an environment not suitable for software debugging activities.
To help address these types of issues, DMON can be used in a client-server configuration, with the target system connected directly to a DMON server, and a client DMON linked to the server over the Internet. The link between them is secured using SSL.
The user on the DMON client is able to carry out all the functions available when connected directly to the target.
In addition the user can ask for a session to be kept alive, and shut down the client only. Any client can re-connect to this session later by giving the session-id.
Commands are provided also to allow a client download program files to a designated area on the server. These can then be loaded into target memory by any client.
In the client-server configuration a license is not required on the client DMON.
Define alias for DMON command
DMON provides a mechanism to define an alias for any of its commands. The DMON installation folder (e.g. C:\Program Files (x86)\DMON\Local) contains a text file called local_commands.txt. This file contains a mapping for commands. The first word is the alias and the second word is the DMON command. For example if the line "reset init" is added to the file, the user can use the command reset to execute the DMON init command.
Elf File Image information
This is primarily metadata such as the sources of the files containing the loaded program images and parameters such as creation and modification dates and times.
By default, when a program is loaded DMON's information about previously loaded programs is deleted and only that for the program just loaded is kept.
The optional add[] parameter of the load and rload commands causes the previous information to be retained.
When an image is loaded, a unique image identifier string is created. By default this is the first part of the filename with internal whitespaces removed. The user can create an identifier using the add[] parameter. (The image identifier is used also as a source identifier when evaluating symbols).
Image information commands:
   iminfo <imageidentifier>	show metadata on specified image or on all images
   iminfodel		     delete all metadata and symbol information
Note that these commands relate only to DMON’s knowledge of what is present on the target and have no effect on the contents of target memory. Program images may be present in target memory but not known to DMON. Target memory areas may be cleared using DMON’s write command if required. DMON only knows about the images that have been loaded in the current DMON session.
Expressions and symbols
A DMON parameter that is an integer number can be given as an expression involving numerals, symbols and operators, e.g. examine 0x40000000, examine main, examine main + 0x1000 * (count + 1). Operators are
+,-,*,/,%,>>,<<,&,^,|, (, ),
with the standard precedence, so evaluation order may differ from that in which operators appear, e.g. examine 2+3*4 evaluates to examine 14, not to examine 20.
Binary numerals start with ‘0b’ or ’0B’, hexadecimal with ‘0x’ or ‘0X’, other numerals that start with 0 are octal (N.B.), and numerals that do not start with 0 are denary (base ten).
Symbols begin with an alphabetic character or underscore ‘_’. They do not contain white space, control characters, the character ‘:’ nor the characters ‘[‘ or ‘]’.
Expressions can include white space, and evaluate to 64 bit long integers. Some commands may reject parameters outside a 32 bit range, making it necessary to 'and' a result with 0xffffffff. In particular this may be needed when results have negative values.
Parameters are separated by white space or a comma(,). If a parameter begins with a unary plus or minus a comma is used to separate it from earlier parameters, e.g. write 0x40000000 + offset , -20 & 0xffffffff 10 writes the value 0xffffffec to 10 words starting at address 0x40000000+offset.
Symbols may be user defined or come from one or more loaded program images. There are also internal DMON symbols generally not used after DMON startup.
The same symbol may be defined in different sources. The instance to use can be specified by prefixing the symbol with a source identifier, e.g. myfile3:main, _user:a.
When a source identifier is used, the symbol is looked for in that source only. Evaluation fails if the symbol does not exist in that source, even though it exists elsewhere.
When no source identifier is used, a symbol is looked for first in DMON’s internal symbols, then in user defined symbols, and finally in the program images. If it cannot be found, or exists only in program images but with differing values, evaluation fails.
A warning is given if a user creates a symbol that conflicts with an existing symbol. The definition takes place and will shadow that symbol in loaded images unless a source identifier is used.
The value associated with a symbol can be found in a number of ways:
lookup <symbolname>	returns the value currently associated with symbolname.
find <symbolname>	finds all occurrences of the symbol unless symbolname includes a source identifier (e.g. myimage:sym), in which case only the specified source is searched.
All symbols that occur in the currently loaded images can be displayed in value order:
symbols <file> show all symbols in currently loaded images or adds symbols from a file.
Further commands are provided for dealing with user defined symbols.
User Defined Symbols
In client-server mode, user defined symbols are known only on the client.
User defined symbols can be constants or variables.
Constant symbols are assigned a value calculated when the symbol is defined. This only changes when the symbol is redefined Variable symbols are assigned an expression. This is re-evaluated each time the symbol is used Commands:
setv symbolname expression	create a constant symbol,  the expression is evaluated when the ‘setv’ command is executed, and a 64 bit signed long integer value assigned to the symbol.  Any language in use has its symbol table updated.
set symbolname expression	create a variable symbol,  the expression is re-evaluated each time the symbol is used. Any language in use has its symbol table updated with the initial value only.
show <symbolname>	shows the expression or value corresponding to the given symbolname, or show all user defined symbols in alphabetical order.
delv [symbolname|#]	delete the user defined symbol or delete all user defined symbols
Examples :
setv a 5		a now has the value 5
setv b a + 7		b now has the value 12
set c a*b		c will evaluate to 60 when next used
setv a 3		a  now has the value 3, b is still 12, unchanged c will evaluate to 36 when next used
Lookup can be restricted to user defined symbols only using the source identifier “_USER:” or “_user:” .
If no source identifier is given, user defined symbols are shadowed by DMON’s internal symbols as these are looked up first. User defined symbols themselves take precedence over symbols defined in the loaded program images.
Load command add[] parameter
This causes DMON's information about the image being loaded to be added to that for the images already present. If not used, DMON’s internal information on images previously loaded is deleted when a program is loaded.
The add[] parameter has a number of optional sub-parameters, allowing the user identify which CPU is to be used with this image, and to define an image identifier to use instead of the default.
When no add[] parameter is used, the load and rload commands set the PCs of all CPUs on the target to the starting address of the image.
If the add[] parameter is used, the user can select the CPU to use with the image. If this is not selected the image start address is not transferred to any CPU’s PC.
Add parameter options (in all cases the information on previously loaded images is kept):
add[] 	             PC is not set, image’s default identifier is used
add[cpu,identifier]	PC of cpu is set to image start address, identifier is used instead of the default
add[CPUx]             PC of CPU x is set to image start address, 'CPUx' used as identifier
add[cpu], add[cpu,], add[cpu,””]    PC of cpu is set to image start address, default identifier is used
add[identifier], add[,identifier]   PC not set, identifier used instead of default
The cpu and x above must evaluate to an integer 0,1,2,... that corresponds to one of the CPUs on the target. If not it is ignored and a warning given to the user.
The identifier above must begin with an alphabetic character or underscore ‘_’. It should not contain control characters or the characters ‘,’ ‘:’, ‘[‘ or ‘]’. If it is illegal or not present the default identifier for the image is used.
Note: the iminfodel command can be used to remove all internal DMON information on previously loaded images.
